I play Chutes and Ladders with my kids sometimes. It isn’t a game of skill. Many months ago I was involved in a game that went on and on and on. As soon as someone would get close to the end he or she would land on a chute and be shunted nearly back to start.
I was left wondering just how long a game would last. So this week my son and I implemented a simulator in Python to calculate how long any one person’s game would last. Each person’s play is independent in Chutes and Ladders, the characters do not interact. Therefore, simulating an entire game is almost as easy as simulating a single player’s experience.
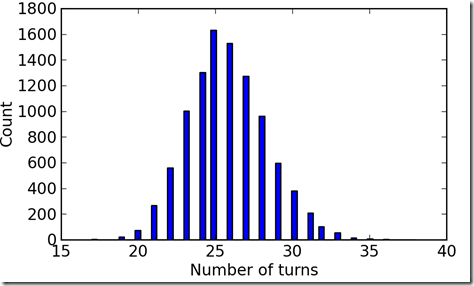
First, the board is 100 cells long and the spinner gives you a value between 1 and 6, just like rolling a die. A fair die will have an average roll of 3.5, so on average it would take about 100/3.5 = 28.6 turns to finish a game if there were no chutes or ladders. The histogram of game length without chutes and ladders is below. The longest plausible game is about 35 turns in this scenario and the average is 28.6 turns, estimated from 10,000 random trials.

The addition of chutes and ladders stretches the histogram radically. Instead of the longest single-person game being about 35 turns, it is now over 200 turns. Fortunately, a 200-turn game is not very likely. Surprisingly the average is not a hundred million years. At 30.8 turns the average game with chutes and ladders is only a little longer than the average game without.
Pretty cool.
import random
import pylab as plt
import numpy as np
d = {}
for i in range(1, 101):
    d[i] = i

cl = {1: 38,
     4: 14,
     9: 31,
     16: 6,
     21: 42,
     28: 84,
     36: 44,
     48: 26,
     49: 11,
     51: 67,
     56: 53,
     62: 19,
     64: 60,
     71: 91,
     80: 100,
     87: 24,
     93: 73,
     95: 75,
     98: 78}
d.update(cl)
numturnsa = []
for t in range(10000):
    numturns = 0
    pos = 0

    while True:
        numturns += 1
        pos += random.randint(1,7)
        if pos > 100:
            break
        # To "play" without chutes and ladders, comment out the next line.
        pos = d[pos]
    numturnsa.append(numturns)

plt.figure(figsize=(5,3))
plt.subplots_adjust( .13, .15, .95, .97)
plt.hist(numturnsa, 60)
plt.xlabel("Number of turns")
plt.ylabel("Count")
plt.savefig("chuteshist_nochutes.png", dpi=200)
numturnsa = np.array(numturnsa, dtype="f")
print "The average number of turns is",np.mean(numturnsa)

