I have a rifle that shoots 3-inch 5-shot groups at 100 yards. This is not adequate for hunting where commonly shots are 200 to 300 yards distant. As I work toward resolving this, there are some interesting statistical problems of practical importance.
In each experiment, how many shots should I fire to measure the spread, 3, 5, 10?
Having fired these shots, how should I measure the “spread”?
When comparing different groups, how likely is it that I will reach a true conclusion with my measurement?
The two methods for measuring spread are (1) the distance between the two farthest points or (2) the standard deviation of the radial distance. The standard deviation is much more difficult to measure, probably you would record an x and y position for each shot, and then calculate the average position, and each point’s distance to the average position, and then take the standard deviations of each point’s distance. The maximum point-to-point distance is very easy to measure. Given the work load, the standard deviation would have to provide better results than the maximum distance. For example, if the standard deviation of a 3-shot group provided a better measurement than the 5-shot group, then it would save ammunition and precious range time.
To compare the performance of the two measurements I assumed a model. The model consists of two different ammunitions (different brand of bullet, amount of powder, whatever). Ammunition A produces a group with standard deviation of 1 inch at 100 yards. This is just an example—a standard deviation of 1 inch would constitute really dreadful performance. Ammunition B produces a group with a standard deviation between one and two inches.
The contrast ratio is defined as the standard deviation of B divided by the standard deviation of A. If the contrast ratio is 1 then both kinds of ammunition perform the same. We expect that it will be hard to tell the difference between ammunitions when the contrast ratio is near one. The other critical element of the model is the statistical distribution. Just like everyone else, I used the Gaussian. I think that the results don’t generalize—heavy-tailed distributions probably produce different outcomes.
Then I simulated 10,000 groups, each containing 3, 4, 5, …,10 shots. I simulated contrast ratios between 1 and 1.5. With the data sets I considered a few metrics:
- What are my chances of correctly determining which ammunition produced a larger group, using the sample standard deviation and the maximum spread measurements?
- On average how well can I measure the contrast ratio, using the sample standard deviation and the maximum spread measurements?
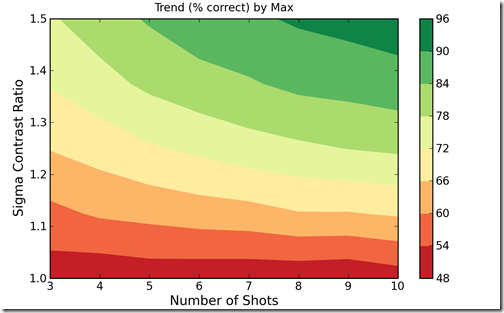
The following figure shows that, using the maximum spread measurement, for contrast ratio of 1.5, a 3-shot group provides about a 76% chance of correctly determining that ammunition B produces a larger group. A 5-shot group has taken the chance to about 85%.
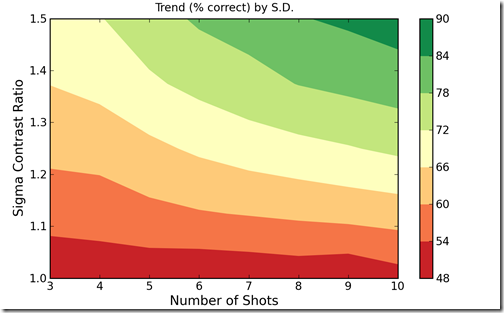
Next, the same measurement using the sample standard deviations shows the same three shot group can differentiate correctly about 70% of the time, or for a 5-shot group about 75% of the time. The difference is stark—no sane person would ever prefer measurements of the standard deviation in favor of the maximum.
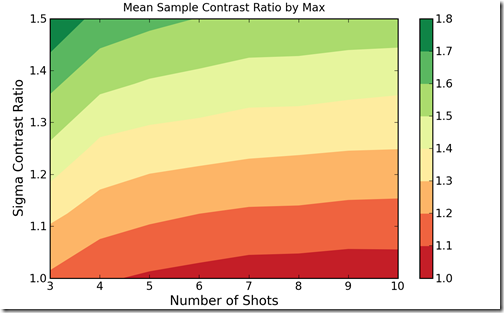
How well can you quantify how much better A is than B? The following chart shows the average ratio of the maximum spread from A divided by the maximum spread from B. One observation is that by 10 shots the results appear to be biased. On average the contrast ratio is underestimated. The bias seems to be consistent enough to be corrected.
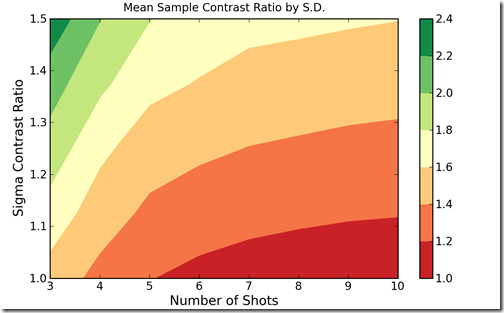
The ratio of the sample standard deviations, as the next plot shows, may be less biased. By 10 shots, though, the estimator is shown to be terrible. As with the maximum spread technique, the bias may be correctable. The slow rate of convergence is not heartening.
My conclusion is that for small ratios a 5 shot group is barely adequate, though coarse differences can be revealed. I will not waste time with exotic measurements of the spread—the maximum spread appears to be superior than the any of the other methods I have tried. Without any information in advance of the test I would prepare for a five shot comparison. Some test of statistical power should probably be applied, analogous to Student’s t-test but for the maximum spread. Obviously, similar spreads should be treated with caution.
This study was performed with Monte Carlo processes because the analytical solutions for maximum spread probabilities are relatively complex—n-fold convolutions of distributions. I believe the solutions to be available, but I lazily elected computer horsepower to Park-power.


