
You have seen the response function contours through the stationary point, and you have seen the 3D response function visualizations. You may recall that I have two competing models, one is derived from the experimental data design for the response surface, and the other is all that data and the screening results too. Is either model any good? Which one is better?
First, a quick review of the model:
q = b0T2 + b1t2 + b2r2 + b3Tt + b4tr + b5Tr + b6T + b7t + b8r + b9
Fitting produces numbers for all those coefficients, b0, b1, etc. Look at the goodness of individual coefficients in the following table. The more asterisks in the significance column, the better the coefficient corresponds to the data. Notice that the “all data” model has an overall terrible goodness, with the residual standard error of 0.7, compared to the residual error of 0.358 for the RSO data only.
|
All Data |
RSO Data Only |
|||||
| Std Error |
0.749 |
0.358 |
||||
| Estimate | Std. Error | Signif. | Estimate | Std. Error | Signif. | |
| (Intercept) |
3.344 |
0.3963 |
*** |
3.6667 |
0.2064 |
*** |
| temp |
-0.355 |
0.2369 |
-0.4375 |
0.1264 |
* |
|
| time |
0.235 |
0.2369 |
0.0375 |
0.1264 |
||
| cwrat |
0.4 |
0.2369 |
0.275 |
0.1264 |
. |
|
| temp:time |
-0.5 |
0.2901 |
-0.75 |
0.1788 |
** |
|
| temp:cwrat |
0.02 |
0.2901 |
-0.375 |
0.1788 |
. |
|
| time:cwrat |
0.09 |
0.2901 |
-0.075 |
0.1788 |
||
| temp^2 |
-0.401 |
0.3592 |
-0.6833 |
0.1861 |
* |
|
| time^2 |
-0.201 |
0.3592 |
-0.4833 |
0.1861 |
* |
|
| cwrat^2 |
0.174 |
0.3592 |
-0.1083 |
0.1861 |
||
| Significance codes: 0 ‘***’ 0.001 ‘**’ 0.01 ‘*’ 0.05 ‘.’ 0.1 ‘ ‘ 1 | ||||||
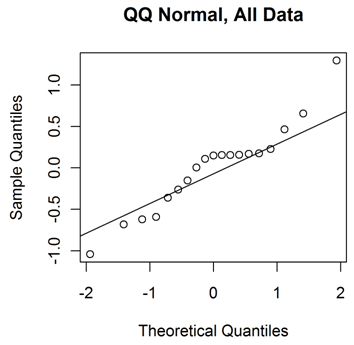
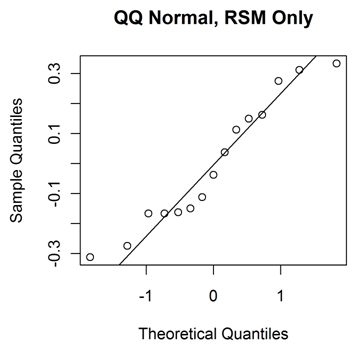
The two graphs below show the quantile normal plots for the residuals from each model. The all-data model looks more systematically erroneous than the RSM data only. The systematic error suggests that the choice of model is not particularly good. Furthermore, it suggests that the estimates of F-statistic should be considered hesitantly, as F-statistics are calculated by assuming normally distributed independent errors.
With hesitation then, let’s examine the F-statistic for these models. The RSO data model produces an F-statistic of 6.4, well above the Box, Hunter, and Hunter criterion that the F-statistic exceeds 4. On the other hand, the all data model’s F-statistic is a miserly value of 1.
| All Data | RSO Data Only | |
| Degrees of Freedom | 9 | 5 |
| Residual Standard Error | 0.749 | 0.358 |
| F-statistic | 1.06 | 6.43 |
In conclusion, I get a better fit—to the indicated model—using only some of the data. This is, frankly, an indictment of the model. Anyone can carefully select data to produce a good fit to a model, and the fact that I have done so may be considered a round condemnation of my objectivity. I may reconsider the model, and attempt to drop the least important terms while adding either a three-way interaction or two-way involving squares. Perhaps more creative math will be required.