
I have executed the experiment design discussed Coffee: Design of the Experiments (Part 2: RSO). This “response surface method” experiment design is carefully crafted to provide the data necessary to fit a formula of the form
q = b0T2 + b1t2 + b2r2 + b3Tt + b4tr + b5Tr + b6T + b7t + b8r + b9
This model describes quadratic terms (T2, t2, r2), main effects (T, t, r), and first-order interactions (Tt, tr, Tr). The model basically assumes that quality is locally curved or locally linear, but not an undulating surface. This assumption of local smoothness is a good one in this case—were it not the experience of buying a cup of a coffee would be a dangerous gamble where small changes made by the brewer resulted in big changes in our cup.
Some possible findings in our analysis
- There is a maximum value of q at some point in the design space, whose approximate location we can find with the preceding method.
- There is a maximum value of q at the edge of the design space, that is, we might find that the best q occurs at some maximum value of concentration (a face of the design cube), or even, for example, the maximum value of concentration and temperature (an edge of the design cube), or a maximum of all the values (a corner of the design cube).
- Some variables don’t matter, and the entire experience is governed by only one variable—indeed the screening experiment hinted at this outcome.
If the optimum is inside the design space, then I know immediately how to brew the best cup of coffee—within some amount of error. If the optimum is outside the design space, at least I know which experimental trend to pursue. Namely, new experiments are positioned along the path of most rapid ascent, or a new design cube is positioned outside the current design cube, with the center moved along the path of most rapid ascent.
Results
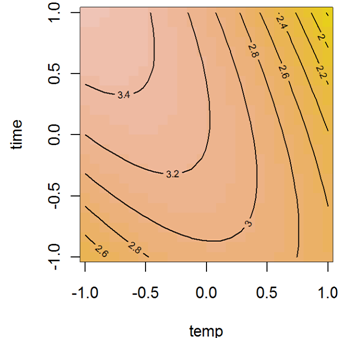
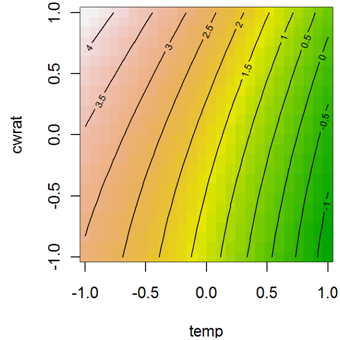
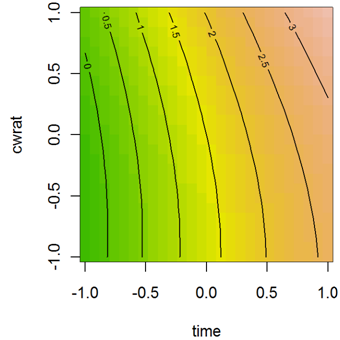
The following three graphs show slices through the response surface fit to the experiments. The slices are positioned so that they intersect the “stationary point”. If there is a local maximum, then it is the stationary point; the plots then display the local sensitivity around that stationary point. The quadratic fit can also produce saddle-shaped responses, in which case the center of the saddle is a stationary point.
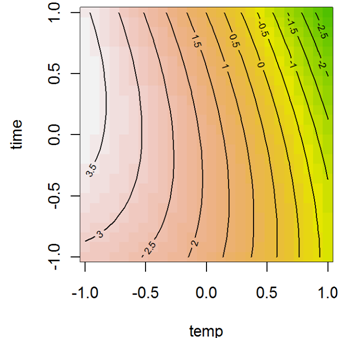
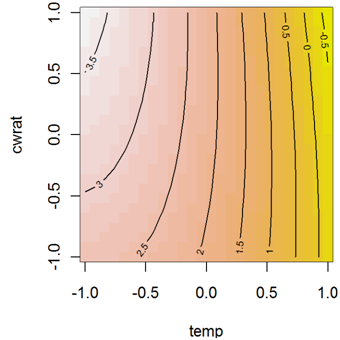

Note that these plots are all based on the fit to just the response surface design. A different fit is obtained by including the data from the screening results.
The graphs all work in “coded variables”, that is, they are all adjusted so that the values lie between -1 and 1. It is necessary to decipher these values into measureable numbers, which the following equations do. The coded value is indicated with a c subscript.
Time tc = 1.35log10(t) – 2.35
Temperature Tc = 0.1(T – 195)
C/W Ratio rc = 50(r – 0.055)
These equations are easily inverted, though below I provide uncoded (normal) values for the points in the steepest ascent.
The fitted space suggests that water temperature is important—certainly more important than the screening experiment suggested. However, my cup quality actually improves as the temperature declines. Almost all the brewing words I’ve read, including the latest Consumer Reports, harp on the importance of getting water hot enough. My experiment suggests that modulating extraction duration and C/W ratio are at least as important.
Steepest Ascent
The response surface methodology encourages further experiment design. Starting from the stationary point, you can follow the path of steepest ascent to move toward ever better quality—at least in theory. To my surprise, this worked for a one-trial qualitative test; more on that later. The steepest ascent predicted using the fit to just the RSO data is shown in the next table. Note that the concentration of coffee is quickly leaves the design space, which was limited to concentrations less than 0.075.
| Steepest (RSO only) | |||||
| Time [sec] |
Coffee [g] |
Water [fl oz] |
Temp [F] |
C/W Ratio [g/ml] |
Predicted Q |
| 55 |
22.3 |
13.7 |
195 |
0.055 |
3.7 |
| 69 |
22.3 |
12.1 |
192 |
0.062 |
3.9 |
| 90 |
22.3 |
10.7 |
190 |
0.071 |
4.1 |
| 116 |
22.3 |
9.5 |
187 |
0.079 |
4.3 |
| 148 |
22.3 |
8.6 |
185 |
0.088 |
4.4 |
| 188 |
22.3 |
7.8 |
183 |
0.096 |
4.6 |
| 238 |
22.3 |
7.2 |
181 |
0.105 |
4.7 |
| 301 |
22.3 |
6.6 |
179 |
0.114 |
4.8 |
| 380 |
22.3 |
6.2 |
177 |
0.123 |
4.9 |
| 479 |
22.3 |
5.7 |
175 |
0.131 |
5.0 |
| 601 |
22.3 |
5.4 |
173 |
0.140 |
5.0 |
A similar fit using all the available data produced the steepest ascent trials in the next table. It is, perhaps, less believable since the quality values rise in excess of 10.
| Steepest (RSO + Screening) | |||||
| Time [sec] |
Coffee [g] |
Water [fl oz] |
Temp [F] |
C/W Ratio [g/ml] |
Predicted Q |
| 55 |
22.3 |
13.7 |
195 |
0.055 |
3.3 |
| 78 |
22.3 |
12.0 |
193 |
0.063 |
3.7 |
| 105 |
22.3 |
10.4 |
192 |
0.072 |
4.0 |
| 132 |
22.3 |
9.2 |
191 |
0.082 |
4.5 |
| 161 |
22.3 |
8.2 |
190 |
0.092 |
5.1 |
| 192 |
22.3 |
7.4 |
190 |
0.102 |
5.7 |
| 226 |
22.3 |
6.8 |
190 |
0.112 |
6.4 |
| 264 |
22.3 |
6.2 |
189 |
0.121 |
7.2 |
| 307 |
22.3 |
5.7 |
189 |
0.131 |
8.1 |
| 355 |
22.3 |
5.3 |
189 |
0.141 |
9.1 |
| 409 |
22.3 |
5.0 |
188 |
0.151 |
10.2 |
Despite the implausibility, I conducted a trial of the 3rd experiment in the combined table, that is, 105 seconds extraction at 192 F for a 0.072 concentration coffee. My results:
“Quality = 4.2. Toasted marshmallow flavor! Aroma is rich and without char. Acid and bitter are nicely balanced in the first sip but the bitter dominates the aftertaste.”
The quality agreement (and I really didn’t peak) is unexpectedly close—4.2 instead 4. Furthermore, there I was genuinely surprised at entirely new flavors. It really was a great cup of coffee. Damned strong though.
For comparison, the contour plots produced by the fit to the RSO data and the screening data are shown next.
A future post will discuss the goodness of fit, and whether the models are meaningful. For the present, rest assured that predicting a quality of 4 and measuring the same convinces me that the results are useful.
Data
The actual data, along with my notes at the time, is shown in the following table.
| Coffee [g] |
Water |
C/W |
Time [sec] |
Temp [F] |
Trial Order |
Q |
Date |
Comment |
| 22.8 |
14.0 |
0.055 |
300 |
205 |
1 |
1.5 |
2/20/2009 |
Not good. Bitter flavor with simple aroma. Too bitter |
| 22.8 |
22.0 |
0.035 |
55 |
205 |
2 |
2.5 |
2/23/2009 |
Simple flavor with muted cemplexity. Aroma and flavor dominated by char. Neither too bitter nor too acid. Not balanced though. |
| 22.8 |
14.0 |
0.055 |
10 |
205 |
3 |
2.5 |
2/24/2009 |
Too bitter. Aroma fairly simple. Mouth feel too watery. Little acidity, poorly balanced between acid and bitter. |
| 22.8 |
10.3 |
0.075 |
55 |
185 |
4 |
4 |
2/25/2009 |
Aroma is excellent w/ complex interesting smells. There is some crema. Nicely acidic and reasonably balanced w/ bitter. |
| 22.8 |
14.0 |
0.055 |
55 |
195 |
5 |
3.5 |
3/2/2009 |
Acid-bitter balance too heavy on bitter side. Nice crema and nice aroma. Rich mouth feel. |
| 22.8 |
22.0 |
0.035 |
10 |
195 |
6 |
3 |
3/3/2009 |
Moderately well balanced. Aroma is simple. Mouth feel watery. |
| 22.8 |
14.0 |
0.055 |
55 |
195 |
7 |
4 |
3/4/2009 |
Well balnced w/ good aroma. A little too bitter, but not unpleasant. |
| 22.8 |
10.3 |
0.075 |
10 |
195 |
8 |
3.5 |
3/5/2009 |
Aroma somewhat simple. Flavor strong or even rich. Too bitter overall and acid/bitter balance poor. |
| 22.8 |
14.0 |
0.055 |
10 |
185 |
9 |
2 |
3/6/2009 |
Bitter simple flavor without much acid. Aroma is farily good but not as rich as I like. |
| 22.8 |
10.3 |
0.075 |
300 |
195 |
10 |
3 |
3/9/2009 |
Smelled bitter. Taste moderately well balanced with a little too much bitter. Rich feel. |
| 22.8 |
22.0 |
0.035 |
300 |
195 |
11 |
2.8 |
3/10/2009 |
Watery. Yet implanaced toward bitter. Flavor is well-bodied and aroma good. |
| 22.8 |
10.3 |
0.075 |
55 |
205 |
12 |
2.5 |
3/11/2009 |
Burned and charred taste. Too bitter while also being nicely acidic. Not well balanced. Aroma dominated by char. |
| 22.8 |
22.0 |
0.035 |
55 |
185 |
13 |
2.5 |
3/12/2009 |
Aroma dominated by char and relatively uninteresting. Taste is poorly balanced–too bitter. Strong flavor. |
| 22.8 |
14.0 |
0.055 |
300 |
185 |
14 |
4 |
3/16/2009 |
Well balanced and nicely aromatic. A little bitter on the finish. |
| 22.8 |
14.0 |
0.055 |
55 |
195 |
15 |
3.5 |
3/17/2009 |
Bitter flavor with weak mouth feel and low complexity. Aroma nicely balanced though. |
Comments
4 responses to “Coffee: Analysis & Results of the Response Surface”
Wow, your dedication to tracking down the perfect coffee recipe amazes me! Once you have it nailed down, I’ll have to fly out for a cup!
Well, the best recipe I’ve tried so far is:
8.2 fl. oz. water heated to 190 degrees F, poured over 22.3 grams of coffee grounds (freshly ground), and steeped for 2 minutes 41 seconds.
You won’t believe how strong a cup this makes. It may not be to your liking (remember, I’m a Starbucks fan), but it is a pretty damned good cup to me.
Strong is excellent with me, burnt tasting is another matter. As long as it’s true coffee flavor, I say go as strong as possible. To me Starbucks just always tastes burnt. I will say though that I like their mochas.
Starbucks roasts to a very dark roast. That is, they burn the beans. You might try the same recipe with different beans, look for a medium roast. For some reason, most of what you can buy seems to be dark roasting. Check out http://www.sweetmarias.com/roasting-VisualGuideV2.html for a look at roast intensity. Probably you can find a city roast somewhere, but a lot of stuff sold seems to be “dark” or “French”. These are going to carry a little of the char flavor.
My experimentation has revealed that the burned flavor is strongly controlled by the temperature, C/W ratio, and extraction time. It is likely that using a different roast from what I used will result in a sub-optimal cup. Grind is an uncontrolled variable too, and since you don’t have a Detestitron, you’ll definitely be different there.